
Some places in the Netherlands have city heating. The intention is to reuse warmth from industry to heat your houses and get warm water. In theory this is a very nice system, but in real world this provides pure vendor lock in, as you can’t switch vendor. This makes city heating very expensive for the consumer. Also most of the warmth is not generated by (green) industry residual warmth but generated by burning gas, biomass and other fuels. So not really a green solution. But enough about my complaints about city heating. More important: how can you read the values and get insights of your usage.
The idea of a smart home is not to only control your home, but also get insights out of your home. A warm home and shower is a crucial for a comfortable day-to-day. It’s also the most one of the biggest costs of living. So we need insights.
Home Assistant has an amazing Energy dashboard, that can also your heating by gas. Unfortunately city heating is not measures with M3 gas but it’s measured measurement called GigaJoule (GJ). So how do we get the energy insights of city heating into Home Assistant?
That’s what I’m going to describe in this article :).
How does city heating work (stadsverwarming)? What is GJ and M3?
A heat meter consists of a volume meter, Two pieces of temperature sensors (one for incoming water temp and one for the return water temperature).
The energy consumption is calculated in the calculation module of the heat meter. This meter calculates the amount of volume and temperatures into energy in GigaJoule (GJ) every 2 seconds.
Energy is calculated using the following formula: Q=M x C x Delta T
Q= Energy
M = Mass (measured water volume)
C = Specific heat of the medium (this changes with the temperature and the differences are also included in the calculation)
Delta T = Flow temperature – return Temperature
Luckily the city heating convertor takes care of this calculations, we don’t need to worry about this we will only use GJ and M3.
Convert heat to m3.
To get a clearer picture of your actual consumption, it can be useful to convert consumption in GJ to m3 gas. You can do this with the following formula: Heat GJ x 32 = … m3 gas
Domestic hot water
Domestic hot water is measured with only a volume meter. Convert the measured volume in m3 from the annual consumption / meter readings for hot tap water to GJ with the following rule: Hot tap water m3 x 0.21 = …GJ
We will use the formula for M3 to GJ and GJ to M3 to translate the city heating to gas M3 measurements, which we than can use in the Energy dashboard of Home Assistant.
What do we need to read city heating values?
To build read-out the measurements you need following hardware.
IR Schreib/Lesekopf USB (Optokopf)
An IR Schreib/Lesekopf is a Infrared read and write USB device. It’s a German device. I’ve ordered it directly from the manufactory and it arrived in the Netherlands in 4 days. The price at the moment was about 45 euro’s: IR Schreib/Lesekopf USB (Optokopf)-ART0027 (weidmann-elektronik.de)
UPDATE: In the comments of this article I got a tip from Erik for a cheaper variant from AliExpress. Click here to order from AlieExpress the costs are around 20-25 euro’s, the delivery thime will be a bit longer than ordering from Germany.

Raspberry Pi (RPI)
A Raspberry Pi is a small, cheap, low energy using micro computer. The IR sensor will be connected through USB to this RPI, the RPI will linux and will be used to execute scripts that will get the measurements from the Kamstrup and send it over to Home Assistant.
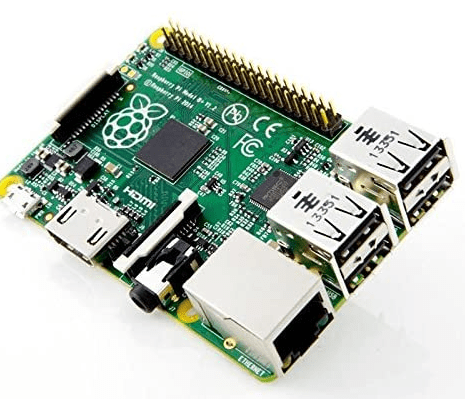
You can buy a Rasberry Pi at almost every electronic store. Here’s a direct link for Amazon. Perhaps you have an old one laying around, this can basically run from any RPI. You don’t need a fancy shiny fast new one 🙂
Make sure that you have a microSD card (min 8GB), a powerfull USB charger with a micro USB cable.
Let’s start the build
1. Install Rasbian on the Rasberry PI
Follow the instructions on the Raspberry.org page on Installing Raspbian with NOOBS
2. Install and configure the Mosquitto MQTT broker addon in Home Assistant
Follow steps on this Github page to confige the MQTT broker in Home Assistant.
addons/DOCS.md at master · home-assistant/addons · GitHub
3. Install the scripts to read out the measurements from the Kamstrup
My city heater is a Kamstrup Multical 402. I’ve tried to find solution to read out the heater before, but never with success. During my recent search I stumbled on a great Github repository from Matthijs Visser.
He created a project that provides a Python library that enables communication with the Kamstrup Multical 402 heat meter. The configured parameters will be read from the meter at a certain interval and published in MQTT messages. On his Github page you can find all the steps to install his script including the pre-requisites. I do want to provide a few additional details for the less technical people that want to build this.
I’m not going into to much details, but I want to provide you enough to get started.
- Get SSH access to your RPI (here’s an article that explains how to do this)
- Install pre requisites for the script to work. On the Github page of the script is a list of pre requisites. You need to install these scripts; Pyserial, Paho MQTT and yaml. You can do this using following commands.
sudo su
apt-get update
apt-get install python3-pip
pip3 install pyserial
pip3 install paho-mqtt
pip3 install yaml-1.3
- Download (clone) the scripts
You now need to download the scripts from the Github repository. You will do this by downloading Git and cloning the repository using following commands.
apt-get install git
git clone https://github.com/matthijsvisser/kamstrup-402-mqtt.git
- Configure the script
Read the Github instruction from Matthijs. In short this is what you need to do. Open the config.yaml and configure your MQTT broker and parameters you want to send.
nano config.yaml
In the config yaml set the IP of the MQTT broker you configured at step 2.
mqtt:
    host: 192.168.0.3
    port: 1883
    client: kamstrup
    topic: kamstrup
    qos: 0
    retain: False
    authentication: False

serial_device:
    com_port: /dev/ttyUSB0
kamstrup:
    parameters:
    - energy
    - volume
    - temp1
    - temp2
    - tempdiff
- Place the IR reader on the Kamstrup and verify the data.
Find the right place to put the IR reader. It needs to be located right across the two IR leds exposed on the Kamstrup. This is very precise work and you need to place the IR reader and execute the script while watching the log. Again all documented very well on Matthijs his GIT page. If everything goes correctly you should see something like this in your log.
- Run the script as service
Follow the steps on Matthijs his Git to run the script as a service -> instructions.
Create sensors in Home Assistant
Perfect, we’re all set. The RPI is sending the readings to the MQTT broker. We can now go into the configuration.yaml and read the values from MQTT and translate them to sensors.
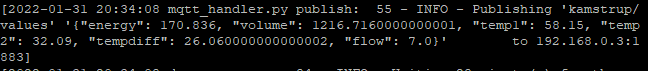
In the configuration of the script we defined the topic of the MQTT message as /kamstrup/. Following JSON values are posted to the MQTT broker in the topic kamstrup/values.
{
  "energy": 170.127,
  "volume": 1212.508,
  "temp1": 56.300000000000004,
  "temp2": 31.900000000000002,
  "tempdiff": 24.400000000000002,
  "flow": 7
}
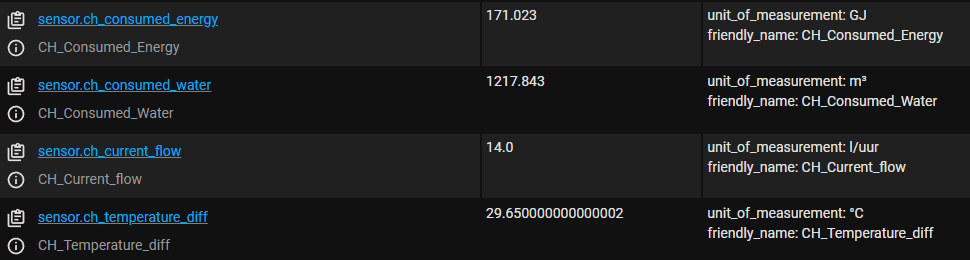
Open your Configuration.yaml and add following mqtt sensors.
- platform: mqtt
    name: "CH_Consumed_Energy"
    state_topic: "kamstrup/values"
    value_template: "{{ value_json.energy }}"
    unit_of_measurement: "GJ"
  - platform: mqtt
    name: "CH_Consumed_Water"
    state_topic: "kamstrup/values"
    value_template: "{{ value_json.volume }}"
    unit_of_measurement: "m³"
  - platform: mqtt
    name: "CH_Temperature_in"
    state_topic: "kamstrup/values"
    value_template: "{{ value_json.temp1 }}"
    unit_of_measurement: "°C"
  - platform: mqtt
    name: "CH_Temperature_out"
    state_topic: "kamstrup/values"
    value_template: "{{ value_json.temp2 }}"
    unit_of_measurement: "°C"
  - platform: mqtt
    name: "CH_Temperature_diff"
    state_topic: "kamstrup/values"
    value_template: "{{ value_json.tempdiff }}"
    unit_of_measurement: "°C"
  - platform: mqtt
    name: "CH_Current_flow"
    state_topic: "kamstrup/values"
    value_template: "{{ value_json.flow }}"
    unit_of_measurement: "l/uur"
This will provide you with a number of sensors you can use in you dashboards. Restart Home Assistant and execute the script on the RPI. Now check in the Home Assitant Developer Tools if the states are updated.
Translate GJ into gas that we can use in the Energy Dashboard
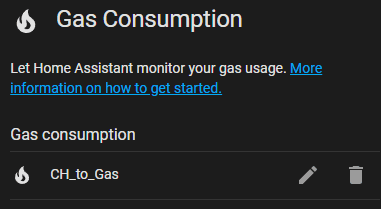
Add following mqtt sensor in the configuration.yaml, directly under the other sensors you just created.
  - platform: mqtt
    name: "CH_to_Gas"
    state_topic: "kamstrup/values"
    # apply formula to value to translate to gas
    value_template: "{{ value_json.energy | float * 32 }}"
    unit_of_measurement: "m³"
    state_class: 'total_increasing'
    # Set device class to gas so we can use the sensor in the energy dashboard
    device_class: 'gas'
In this sensor we’re applying the GJ to M3 gas formula as the value and setting the device_class to gas. Restart home assistant and now add the gas sensor as Gas Consumptoin source in the energy settings (Configuration -> Energy)
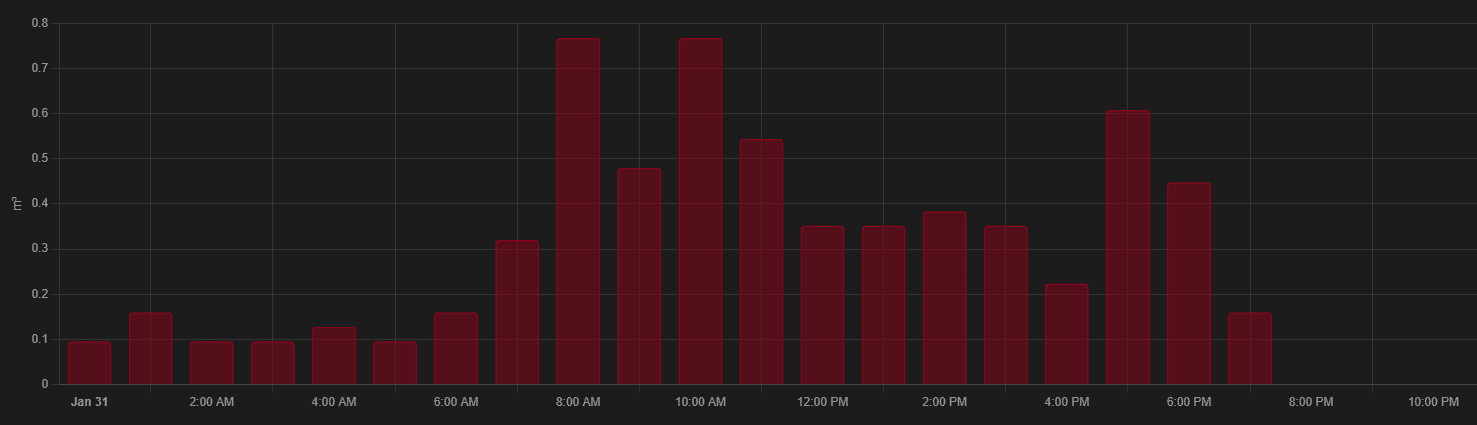
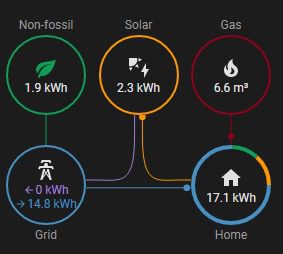
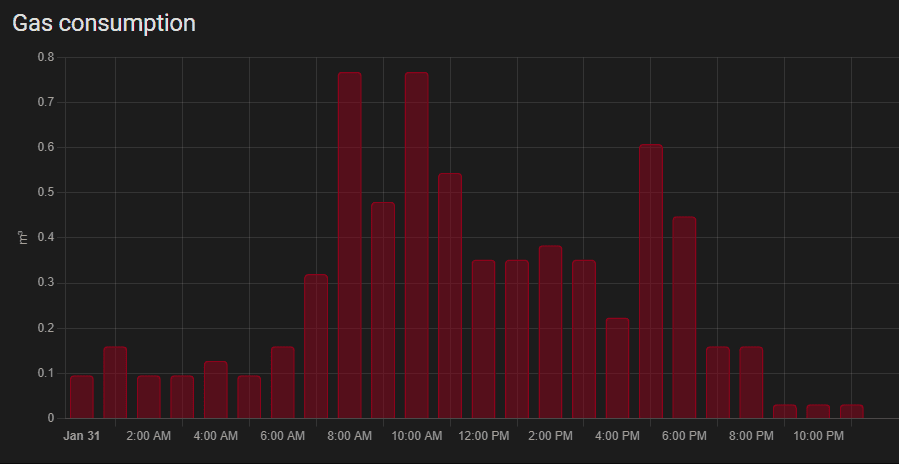
The results
Now wait a few hours and see your city heating consumption appear in the Energy dashboard of Home Assistant. You’ll now get insights in how much heating you use.
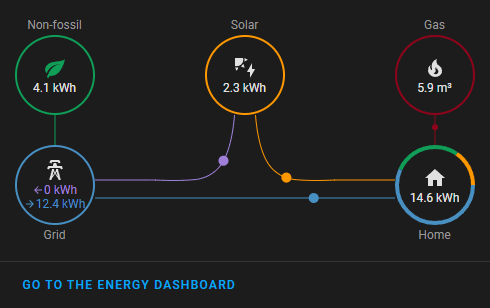
And also the Gas will be added to the very cool Energy Distribution widget.
Hope this article helped. Let me know if you have any questions. Big thanks to Matthijs Visser for his great work on the scripts to read out the values.
Happy automating!
Short summary in Dutch
Dit is de oplossing om Eneco stadsverwarming en ook anderen stadsverwarming meters uit te lezen. Zelf heb ik een Kamstrup 402 en hiermee werkt deze oplossing perfect. Het artikel zou te volgen moeten zijn voor iedereen met technische interessen en mensen die zelf het leuk vinden om te knutselen.
Het grote voordeel is dat je hiermee inzicht krijgt in je verbruik van stadsverwarming. De sensor leest tot 3 cijfers achter de comma uit. Hierdoor kan je echt per uur goed zien wat je verbruikt, het Home Assistant Energy dashboard is hier het perfecte middel voor.
Ik hoop dat het helpt!